监控与日志
适用于 xiaozhi-mcphub 1.1.0。
概述
XIAOZHI-MCPHUB 提供全面的监控和日志功能,帮助您跟踪服务器性能、调试问题和维护系统健康。
实时监控
服务器状态仪表板
XIAOZHI-MCPHUB 仪表板提供所有注册 MCP 服务器的实时监控:
- 服务器健康: 在线/离线状态,自动健康检查
- 响应时间: 每个服务器的平均、最小、最大响应时间
- 请求量: 每秒/分钟/小时的请求数
- 错误率: 成功/失败比率和错误趋势
- 资源使用: 内存和 CPU 利用率(如果可用)
健康检查配置
为您的 MCP 服务器配置健康检查:
json
{
  "healthCheck": {
    "enabled": true,
    "interval": 30000,
    "timeout": 5000,
    "retries": 3,
    "endpoints": {
      "ping": "/health",
      "tools": "/tools/list"
    }
  }
}
监控 API
以编程方式获取监控数据:
bash
# 获取服务器健康状态
curl http://localhost:3000/api/monitoring/health
# 获取性能指标
curl http://localhost:3000/api/monitoring/metrics?server=my-server&range=1h
# 获取系统概览
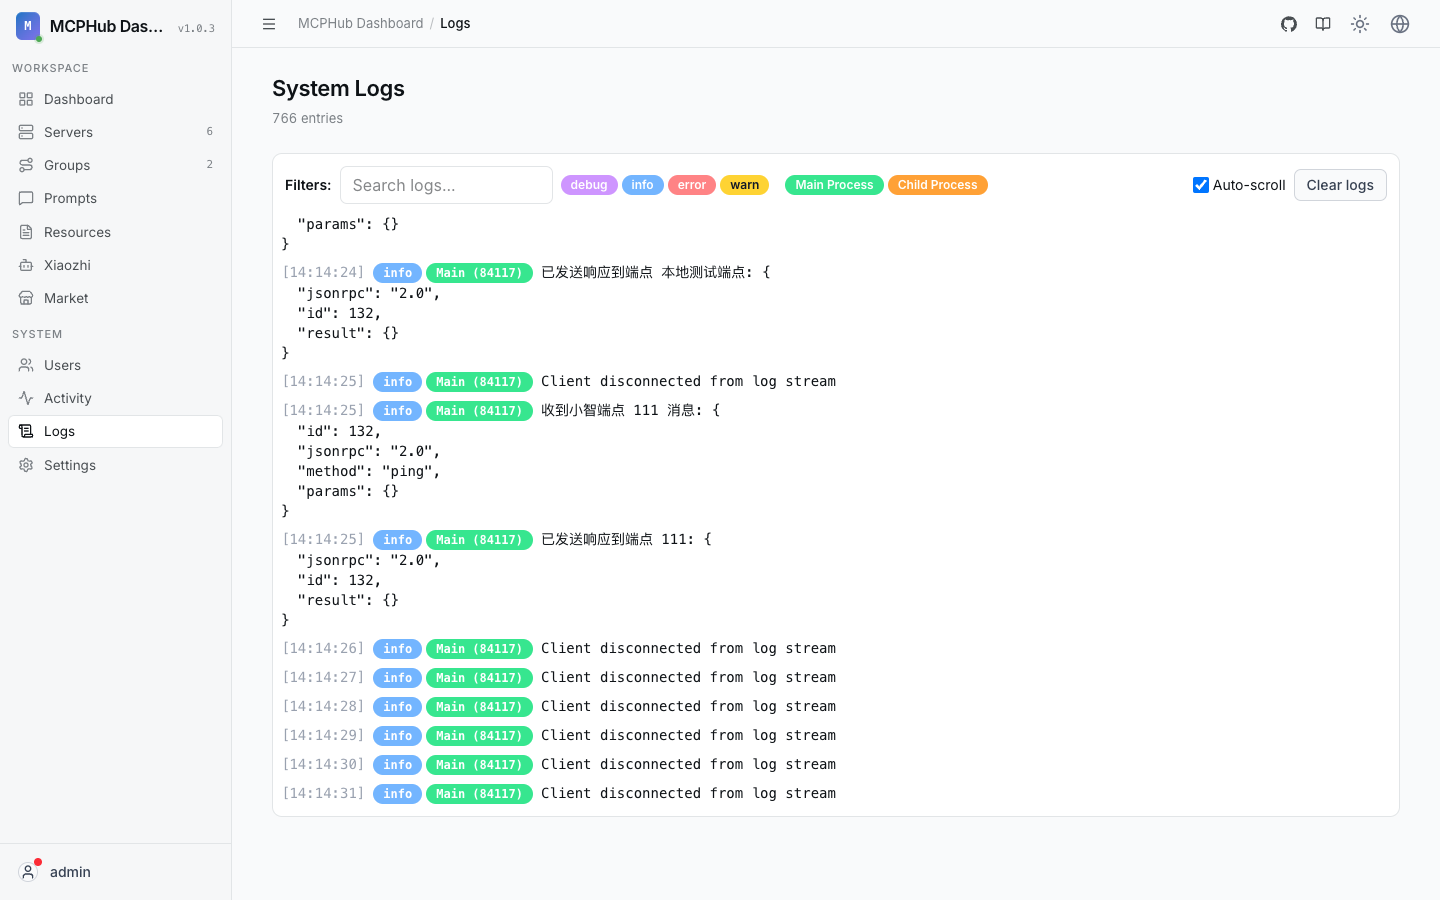
curl http://localhost:3000/api/monitoring/overview日志系统
日志级别
XIAOZHI-MCPHUB 支持标准日志级别:
- ERROR: 需要立即注意的关键错误
- WARN: 应该监控的警告条件
- INFO: 一般操作消息
- DEBUG: 详细调试信息
- TRACE: 非常详细的跟踪信息
日志配置
在环境中配置日志:
bash
# 设置日志级别
LOG_LEVEL=info

# 启用结构化日志
LOG_FORMAT=json

# 日志文件位置
LOG_FILE=/var/log/xiaozhi-mcphub/app.log

# 启用请求日志
ENABLE_REQUEST_LOGS=true
结构化日志
XIAOZHI-MCPHUB 使用结构化日志以便更好地分析:
json
{
  "timestamp": "2024-01-20T10:30:00Z",
  "level": "info",
  "message": "MCP server request completed",
  "server": "github-mcp",
  "tool": "search_repositories",
  "duration": 245,
  "status": "success",
  "requestId": "req_123456",
  "userId": "user_789"
}
日志管理
日志存储选项
基于文件的日志
yaml
# docker-compose.yml
services:
  xiaozhi-mcphub:
    volumes:
      - ./logs:/app/logs
    environment:
      - LOG_FILE=/app/logs/xiaozhi-mcphub.log
      - LOG_ROTATION=daily
      - LOG_MAX_SIZE=100MB
      - LOG_MAX_FILES=7
数据库日志
json
{
  "logging": {
    "database": {
      "enabled": true,
      "table": "logs",
      "retention": "30d",
      "indexes": ["timestamp", "level", "server"]
    }
  }
}
外部日志服务
bash
# Syslog 集成
SYSLOG_ENABLED=true
SYSLOG_HOST=localhost
SYSLOG_PORT=514
SYSLOG_FACILITY=local0

# ELK Stack 集成
ELASTICSEARCH_URL=http://localhost:9200
ELASTICSEARCH_INDEX=xiaozhi-mcphub-logs
日志轮转
自动日志轮转配置:
json
{
  "logRotation": {
    "enabled": true,
    "maxSize": "100MB",
    "maxFiles": 10,
    "compress": true,
    "interval": "daily"
  }
}
指标收集
系统指标
XIAOZHI-MCPHUB 收集各种系统指标:
javascript
// 收集的指标示例
{
  "timestamp": "2024-01-20T10:30:00Z",
  "metrics": {
    "requests": {
      "total": 1547,
      "success": 1523,
      "errors": 24,
      "rate": 12.5
    },
    "servers": {
      "online": 8,
      "offline": 2,
      "total": 10
    },
    "performance": {
      "avgResponseTime": 156,
      "p95ResponseTime": 324,
      "p99ResponseTime": 567
    },
    "system": {
      "memoryUsage": "245MB",
      "cpuUsage": "15%",
      "uptime": "72h 35m"
    }
  }
}
自定义指标
定义自定义业务指标:
javascript
// 自定义指标示例
const customMetrics = {
  toolUsage: {
    fetch_html: 234,
    playwright_click: 189,
    sqlite_query: 156
  },
  userActivity: {
    activeUsers: 45,
    newUsers: 12,
    sessionDuration: "23m"
  },
  businessMetrics: {
    documentsProcessed: 1024,
    apiCallsSuccessful: 2847,
    costPerRequest: 0.002
  }
};
指标导出
将指标导出到外部系统:
bash
# Prometheus 指标端点
curl http://localhost:3000/metrics

# Grafana 仪表板配置
curl http://localhost:3000/api/monitoring/grafana/dashboard

# 自定义指标导出
curl http://localhost:3000/api/monitoring/export?format=json&range=24h
性能监控
响应时间追踪
监控各种操作的响应时间:
json
{
  "responseTimeMetrics": {
    "server_startup": {
      "avg": 2500,
      "p95": 4200,
      "p99": 7800
    },
    "tool_execution": {
      "avg": 156,
      "p95": 324,
      "p99": 567
    },
    "api_requests": {
      "avg": 89,
      "p95": 145,
      "p99": 234
    }
  }
}
资源监控
跟踪系统资源使用:
bash
# 获取资源使用情况
curl http://localhost:3000/api/monitoring/resources

# 响应示例
{
  "cpu": {
    "usage": "15%",
    "cores": 4,
    "loadAverage": [0.5, 0.8, 1.2]
  },
  "memory": {
    "used": "245MB",
    "total": "2GB",
    "usage": "12%"
  },
  "disk": {
    "used": "15GB",
    "total": "100GB",
    "usage": "15%"
  },
  "network": {
    "bytesIn": 1048576,
    "bytesOut": 2097152,
    "connectionsActive": 25
  }
}
告警系统
告警配置
设置自动告警规则:
json
{
  "alerting": {
    "rules": [
      {
        "name": "high_error_rate",
        "condition": "error_rate > 5%",
        "threshold": 0.05,
        "duration": "5m",
        "severity": "warning"
      },
      {
        "name": "server_down",
        "condition": "server_status == offline",
        "duration": "1m",
        "severity": "critical"
      },
      {
        "name": "high_response_time",
        "condition": "avg_response_time > 1000ms",
        "duration": "3m",
        "severity": "warning"
      }
    ]
  }
}
通知渠道
配置多种告警通知方式:
json
{
  "notifications": {
    "email": {
      "enabled": true,
      "smtp": {
        "host": "smtp.gmail.com",
        "port": 587,
        "auth": {
          "user": "alerts@yourcompany.com",
          "pass": "your-app-password"
        }
      },
      "recipients": ["admin@yourcompany.com"]
    },
    "slack": {
      "enabled": true,
      "webhook": "https://hooks.slack.com/services/...",
      "channel": "#alerts"
    },
    "webhook": {
      "enabled": true,
      "url": "https://your-monitoring-system.com/webhook",
      "headers": {
        "Authorization": "Bearer your-token"
      }
    }
  }
}
日志分析
搜索和过滤
高级日志搜索功能:
bash
# 按级别搜索日志
curl "http://localhost:3000/api/logs/search?level=error&from=2024-01-20&to=2024-01-21"

# 按服务器搜索日志
curl "http://localhost:3000/api/logs/search?server=github-mcp&limit=100"

# 复杂查询
curl "http://localhost:3000/api/logs/search" \
  -d '{
    "query": {
      "and": [
        {"level": "error"},
        {"server": {"in": ["fetch", "playwright"]}},
        {"timestamp": {"gte": "2024-01-20T00:00:00Z"}}
      ]
    },
    "sort": [{"timestamp": "desc"}],
    "limit": 50
  }'
日志聚合
生成日志摘要和统计:
bash
# 获取错误摘要
curl http://localhost:3000/api/logs/aggregations/errors

# 按服务器分组的请求计数
curl http://localhost:3000/api/logs/aggregations/requests-by-server

# 时间序列数据
curl http://localhost:3000/api/logs/aggregations/timeline?interval=1h&range=24h
监控仪表板
内置仪表板
XIAOZHI-MCPHUB 包含预建的监控仪表板:
- 系统概览: 高级系统健康和性能
- 服务器状态: 详细的服务器监控
- 请求分析: 请求模式和性能
- 错误跟踪: 错误趋势和调试
- 用户活动: 用户行为和使用模式
自定义仪表板
创建自定义监控视图:
json
{
  "dashboard": {
    "name": "自定义监控",
    "widgets": [
      {
        "type": "metric",
        "title": "总请求数",
        "query": "sum(requests_total)",
        "visualization": "single-stat"
      },
      {
        "type": "chart",
        "title": "响应时间趋势",
        "query": "avg(response_time) by time(1m)",
        "visualization": "line-chart"
      },
      {
        "type": "table",
        "title": "服务器状态",
        "query": "server_status",
        "visualization": "table"
      }
    ]
  }
}
故障排除
常见监控问题
指标不显示
- 检查监控服务是否运行
- 验证数据收集配置
- 确认数据库连接
- 检查权限设置
告警不触发
- 验证告警规则语法
- 检查阈值设置
- 确认通知配置
- 测试通知渠道
性能问题
- 检查监控开销
- 优化数据收集频率
- 配置数据保留策略
- 考虑外部监控解决方案
监控最佳实践
- 设置合理的告警阈值
- 定期审查监控数据
- 保持日志的可读性
- 监控监控系统本身
- 文档化告警响应程序
调试监控问题
bash
# 启用监控调试
DEBUG=xiaozhi-mcphub:monitoring npm start

# 检查监控配置
curl http://localhost:3000/api/monitoring/config

# 测试告警规则
curl -X POST http://localhost:3000/api/monitoring/test-alert \
  -d '{"rule": "high_error_rate"}'